🚀 Explore Darden Restaurants' 2023 Financial Flavors Like a Pro! 📊
Darden Restaurants 2023 Beginner’s Guide Introduction:
Greetings, future financial connoisseurs! Ready to delve into the financial delicacies of Darden Restaurants in 2023? Dive into "Darden Restaurants 2023: Beginner's Guide to Financial Analysis," brought to you by Quality Business Consultant and penned by the financial aficionado, Paul Borosky, MBA. This guide is not your typical financial digest; it's a comprehensive exploration into the fiscal world of one of the leading names in the culinary industry!
Why You'll Love This Guide:
- Insights from a Finance Maestro: 🎓 Navigate Darden Restaurants' financial nuances in 2023 with guidance from Paul Borosky, MBA, and Quality Business Consultant.
- Financial Feast on Darden's Data: 📉 Savor the summary income statements and balance sheets of Darden Restaurants, offering a taste of the company's financial well-being.
- Robust Financial Ratio Analysis: 🧮 Bite into over twenty key financial ratios, understanding what they reveal about Darden's fiscal health.
- Financial Terms, Simplified: 📚 Digest complex financial jargon with our "In other words" sections, making intricate concepts easily palatable.
- Customized Analysis Advice: 💡 Utilize Paul's expert tips to refine your financial scrutiny skills, applicable across various scenarios.
- Expanded Insights with Detailed Report: 🔍 Opt for our "Financial Analysis & Report" for an in-depth financial review of Darden Restaurants, blending AI insights with Paul Borosky's seasoned analysis.
Guide Highlights:
- A friendly Legal Disclaimer
- A Forward that whets your appetite for financial knowledge
- Thorough breakdowns of Income Statements and Balance Sheets for 2023
- A rich selection of Financial Ratios to guide your analytical journey
- An extensive menu of financial insights awaits!
Table of Contents Sneak Peek:
- Delving into Income Statements: Unpacking revenues, expenses, and beyond
- Analyzing the Balance Sheet: Understanding assets, liabilities, and equity – the financial backbone
- Decoding Financial Ratios: Arming you with the tools to assess Darden's financial vitality
Who's This For?
Perfect for ambitious business students and aspiring entrepreneurs, this guide is your culinary map to the financial analysis of Darden Restaurants.
Claim Your Guide:
Boost your financial expertise with "Darden Restaurants 2023: Beginner's Guide to Financial Analysis." Turn the intricate world of financial statements into your strategic advantage.
Additional Note: This guide is crafted to provide a foundational understanding of essential financial concepts, focusing on income statements, balance sheets, and critical financial ratios for their analysis. It presents a summarized portrayal of Darden Restaurants' financials, equipping you with specific data, calculations, and ratios for your analysis venture. While the guide offers the tools for financial exploration, the comprehensive analysis is yours to conduct. For those desiring an exhaustive, company-specific financial review, our "Financial Analysis & Report" delivers detailed insights, combining AI-driven precision with Paul Borosky, MBA's expert evaluation.
PDF/Downloadable Versions

Click Below for the CURRENT
Downloadable PDF Price!!

Click Below for the CURRENT
Downloadable PDF Price!!
Sample Financial Report


Darden Restaurant: Brief Summary
Darden Restaurants, with its headquarters in Orlando, Florida, is a prominent player in the restaurant industry. As a leading company in the consumer cyclical sector, Darden Restaurants operates a diverse portfolio of popular restaurant brands. Some of its well-known brands include Olive Garden, LongHorn Steakhouse, Cheddar's Scratch Kitchen, The Capital Grille, and several others. With an expansive presence, Darden Restaurants boasts a vast network of approximately 1,800 restaurants spanning the United States and Canada. The organization offers a wide range of dining experiences to cater to different tastes and preferences.
Darden Restaurants' success lies not only in its extensive brand portfolio but also in its dedicated workforce. With around 175,000 employees, the company relies on the skills and expertise of its diverse team to deliver exceptional dining experiences to its customers. The commitment to quality, service, and innovation has positioned Darden Restaurants as a respected industry leader. As a result, it continues to thrive and maintain its presence as a top player in the competitive restaurant landscape.
Darden Restaurant Financial Report Sources
The financial analysis report for Darden Restaurants, titled "Darden Restaurant Inc. 2022 Company Analysis... For Beginners: Financial Statements and Financial Ratios: Defined, Discussed, and Analyzed for 5 Years," was authored by Paul Borosky, MBA., owner of Quality Business Plan. This comprehensive report draws information from multiple sources, including Darden's 2022 10k annual report, 2017 10k annual report, 2016 10k annual report, and 2019 10k annual report. The author used these financial statements to extract key data related to Darden's income and balance sheets. By leveraging a customized financial template, the report provides a detailed analysis of Darden's financial performance over a five-year period, offering valuable insights and analysis for readers conducting their own financial analysis.
Darden Restaurant’s Income Statement – Summary Analysis
Within this section, I provide a comprehensive overview of Darden Restaurant's income statement, explaining its significance and the importance of each line item. I delve into the definition and detailed explanation of income statement components such as revenues, gross profits, operating expenses, and net income. By defining and discussing each line item, readers gain a deeper understanding of the financial performance indicators.
Furthermore, I conduct a summary analysis of Darden Restaurant's income statement line item trends. This analysis covers essential aspects of the income statement over a specific period, allowing readers to evaluate the company's revenue generation, cost management, and profitability. This analysis enables readers to make informed decisions and assess Darden Restaurants' financial performance by highlighting significant trends and identifying areas of strength or concern.
Through the combination of clear explanations, insightful definitions, and summary analysis, readers gain a comprehensive understanding of Darden Restaurant's income statement and its implications for the company's financial health and operational efficiency.
Importance of Darden's Income Statement for Financial Analysis
The income statement of Darden Restaurants plays a crucial role in financial analysis as it provides valuable insights into the company's financial performance. Firstly, it allows analysts to examine Darden's revenue sources and assess its ability to generate sales. Analysts can identify growth opportunities and potential risks by analyzing revenue trends. Secondly, the income statement helps evaluate Darden's profitability by examining gross profit, operating income, and net income metrics. This information lets analysts assess the company's operational efficiency and profitability margins. Additionally, the income statement provides a breakdown of expenses, allowing for a detailed analysis of cost structures and expense management. Analysts can identify areas for potential cost reductions or efficiency improvements by scrutinizing these expenses. Furthermore, comparing Darden's income statement with its industry peers enables benchmarking and evaluation of the company's financial performance in relation to its competitors. Lastly, the income statement is valuable for forecasting, budgeting, and strategic planning. Historical income statement data aids in making informed projections and developing effective financial plans. Understanding Darden's income statement is essential for financial analysis as it provides insights into revenue generation, profitability, and expense management and aids decision-making processes.
Revenue Growth:
Darden Restaurant’s revenues were $8 billion as of 2018. Over the next several years, the company would increase its revenues moderately, ending 2022 at $9.6 billion. On average, the annual revenue growth rate over the last five years was about 5.8%. This trend indicates that the company has entered the mature phase of the business cycle and is consistently growing the revenues moderately but seemingly sustainable over the long term. From an investor’s perspective, this is a good trend.
Analyst Grade: A
Darden 2022 Summary Income Statement |
|||||
| Column1 |
2022 |
2021 | 2020 | 2019 |
2018 |
| Revenues |
9,630 |
7,191 | 7,806 | 8,510 |
8,080 |
| COGS |
2,943 |
2,072 | 2,240 | 2,412 |
2,303 |
| Gross Profit |
6,687 |
5,119 | 5,566 | 6,098 |
5,777 |
| SG&A |
466 |
487 | 614 | 405 |
409 |
| Depreciation |
368 |
350 | 356 | 591 |
565 |
| R & D | - | - | - | - | - |
| Other | - | - | - | - | - |
| Total Operating Expenses |
8,468 |
3,630 | 4,157 | 4,248 |
4,031 |
| EBIT |
1,162 |
648 | 48 | 832 |
766 |
| Other Income | - | - | - | - | - |
| Interest Expense |
69 |
63 | 57 | 50 |
161 |
| EBT |
1,094 |
576 | (161) | 782 |
605 |
| Taxes |
139 |
(55) | (111) | 64 |
2 |
| Net Income |
953 |
629 | (52) | 713 |
596 |
Darden Restaurant’s Balance Sheet
In the section analyzing Darden Restaurants' balance sheet, I delve into each significant line item on the statement. Each line item is thoroughly defined, including key components such as cash, property, plant and equipment, and liabilities. Following the definitions, a concise analysis of Darden's crucial balance sheet line items is provided. This analysis offers insights into the company's financial position, asset composition, and overall liabilities. By examining the balance sheet, analysts can assess Darden's liquidity, solvency, and the allocation of its resources. Furthermore, understanding the trends and changes in these line items over time can reveal important patterns and provide valuable information for decision-making, financial planning, and evaluating the company's financial health.
Importance of Darden's Balance Sheet for Financial Analysis
Darden's balance sheet plays a crucial role in financial analysis, providing a snapshot of the company's financial position at a specific time. Analysts can assess the company's liquidity, solvency, and overall financial health by examining the balance sheet.
The balance sheet reveals important information about Darden's assets, liabilities, and shareholders' equity. It helps investors and stakeholders understand the composition and value of the company's assets, such as cash, accounts receivable, and property. By analyzing these assets in relation to liabilities, such as debt and accounts payable, analysts can determine Darden's ability to meet its financial obligations. Additionally, the balance sheet enables comparison and trend analysis over time. By comparing balance sheets from different periods, analysts can identify changes in Darden's financial structure, such as asset allocation shifts or debt levels. Trend analysis helps identify patterns and assess the company's financial stability and sustainability.
Furthermore, the balance sheet is crucial for calculating various financial ratios, such as the current ratio, debt-to-equity ratio, and return on assets. These ratios provide insights into Darden's operational efficiency, leverage, and profitability, enabling investors and stakeholders to make informed decisions and evaluate the company's performance relative to its industry peers. A comprehensive analysis of Darden's balance sheet is essential for understanding its financial position, assessing its ability to meet obligations, and making informed investment decisions.
Cash:
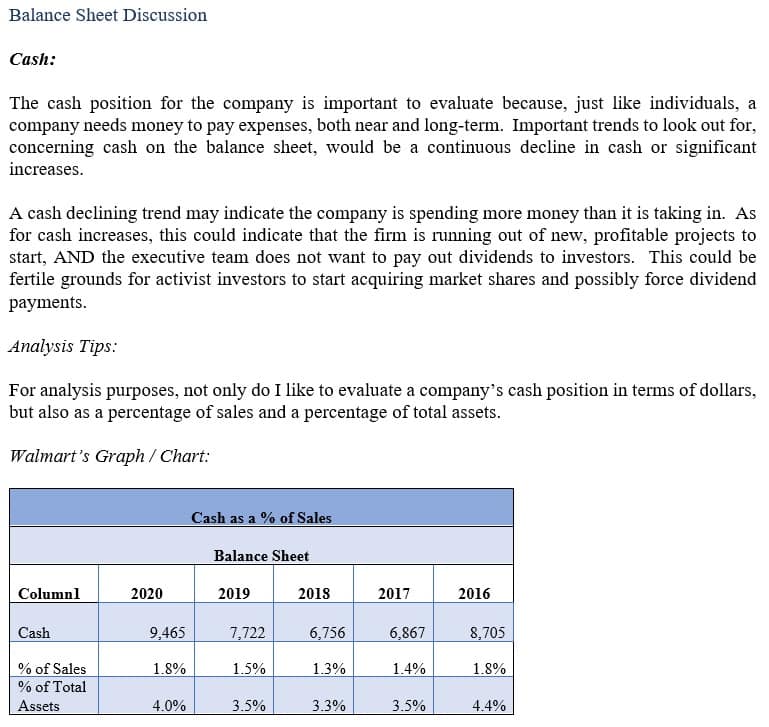
Darden Restaurant’s cash holding was $146 million in 2018. As a percentage of sales, their cash holdings were 1.8%. As of 2022, their cash holdings increased to $421 million or 4.4% of sales. The substantial increase in cash holdings indicates that the organization feels the need to increase its liquidity to ensure current liability coverage. From an investor perspective, a significant increase in idle cash is a concerning and negative trend.
Analyst Grade: B
Darden 2022 Summary Balance Sheet |
|||||
| Column1 |
2022 |
2021 | 2020 | 2019 |
2018 |
| Cash |
421 |
1,214 | 763 | 457 |
146 |
| Short Term Investment | - | - | - | - | - |
| Account Receivable |
72 |
68 | 50 | 88 |
83 |
| Inventory |
271 |
190 | 207 | 207 |
205 |
| Other | - | - | - | - | - |
| Current Assets |
1,179 |
1,871 | 1,101 | 893 |
553 |
| Net PPE |
3,356 |
2,869 | 2,757 | 2,553 |
2,429 |
| Goodwill |
1,037 |
1,037 | 1,037 | 1,184 |
1,183 |
| Other | - | - | - | - | - |
| Total Assets |
10,136 |
10,656 | 9,946 | 5,893 |
5,469 |
| Accounts Payable |
367 |
304 | 249 | 333 |
277 |
| Accrued Expense |
182 |
177 | 150 | 175 |
177 |
| Accrued Taxes |
32 |
35 | 6 | 12 |
- |
| Notes Payable | - | - |
270 |
- |
- |
| LT Debt - Current | - | - | - | - | - |
| Other | - | - | - | - | - |
| Total Current Liabilities |
1,848 |
1,848 | 1,793 | 1,474 |
1,384 |
| LT Debt |
91 |
929 | 929 | 928 |
926 |
| Other | - | - | - | - | - |
| Total Liabilities |
7,938 |
7,843 | 7,615 | 3,500 |
3,274 |
| Common Stock |
2,226 |
2,286 | 2,205 | 1,685 |
1,631 |
| Treasury | - | - | - |
- |
(8) |
| Retained Earnings |
(26) |
522 | 144 | 807 |
658 |
| Other | - | - | - | - | - |
| Total Equity |
2,198 |
2,813 | 2,331 | 2,393 |
2,195 |
| Total Equity & Liability |
10,136 |
10,656 | 9,946 | 5,893 |
5,470 |
Section 3: Darden Inc. Financial Ratios Analyzed
This section presents an analysis of Darden Restaurant Inc.'s financial ratios. A selection of approximately 16 financial ratios is reviewed for the period spanning from 2016 to 2020.

Each financial ratio is defined and accompanied by the corresponding formula for calculation. Furthermore, a concise analysis of these important financial ratios for Darden is provided. This analysis offers insights into Darden's financial performance and helps assess various aspects of the company's operations, such as profitability, liquidity, leverage, and efficiency. By examining these financial ratios, investors and stakeholders can better understand Darden's financial health and make informed decisions based on the company's performance relative to industry benchmarks and historical trends.
Importance of Darden's Financial Ratios for Financial Analysis
Darden's financial ratios play a crucial role in financial analysis, providing valuable insights into the company's financial health and performance. These ratios help evaluate various aspects of Darden's operations, including profitability, liquidity, efficiency, and solvency.
Profitability ratios, such as return on assets (ROA) and return on equity (ROE), assess Darden's ability to generate profits from its assets and shareholders' investments, respectively. These ratios indicate the company's effectiveness in utilizing its resources to generate returns.
Liquidity ratios, such as the current and quick ratios, measure Darden's short-term liquidity and ability to meet its immediate financial obligations. These ratios indicate the company's ability to handle short-term cash flow needs.
Efficiency ratios, such as inventory turnover and receivables turnover, evaluate Darden's effectiveness in managing its assets and generating sales. These ratios help assess the company's operational efficiency and inventory management practices.
Solvency ratios, such as debt-to-equity and interest coverage ratios, examine Darden's long-term financial stability and ability to meet debt obligations. These ratios provide insights into the company's financial risk and leverage.
By analyzing these financial ratios over time, investors, analysts, and stakeholders can comprehensively understand Darden's financial performance, identify trends, compare them to industry benchmarks, and make informed decisions regarding investment, creditworthiness, and strategic planning.
Darden's Current Ratio
Darden Restaurant’s current ratio was .4 in 2018. In the next several years, the organization will improve its current ratio ending in 2021 at 1.01. However, in 2022, the organization would reduce its current ratio to .64. This trend indicates that the company is having moderate difficulties in sustaining a stable current ratio. Investors should be concerned about this trend because it indicates that the organization cannot execute optimal current asset management strategies consistently.
Analyst Grade: B
Darden's Return on Assets
Darden Restaurant’s return on assets (ROA) in 2018 was 10.9%. In 2022, their return on assets was 9.4%. This trend indicates that the company is underutilizing assets under management on a consistent basis in terms of generating revenues. From this, the company either needs to sell off underperforming fixed assets or quickly implement new sales strategies to increase revenues in the short term. From an investor’s perspective, this is a poor trend.
Analyst Grade: C