
Dr. Paul Borosky, DBA, MBA
Business Consultant & Fractional CFO
Four Thousand People Is Not Four Thousand Orders.
An organizer tells you to expect four thousand people, and it is very easy to hear that as four thousand hungry customers walking toward your window. It almost never works out that way. Some of those four thousand arrive after they have already eaten, some brought a cooler from home, some are there for the morning and gone before your service period even starts, and the ones who do want a hot meal spread themselves across every other truck on the lot. The number you actually have to prep for is far smaller than four thousand, and the whole job is finding it. You get there by estimating how many attendees will buy a meal during the hours you are open, estimating what share of those meals come to your truck rather than to someone else's, and then turning that order count into menu items and ingredient quantities.
From there, build three versions of the number instead of one, a low case, an expected case, and a high case, so you can see how much the answer moves when your assumptions are wrong. Then hold all three against what you can actually store safely and serve with the crew and equipment you are bringing, because a forecast the truck cannot physically execute is not a plan. A good forecast tells you what to buy, what to prepare before the gates open, and what to hold back for a later batch. It should never have you cooking every possible meal in the dark hours before the first customer arrives.
In Dr. Paul's experience, the forecasts that hold up are the ones that keep the units straight, and that is harder than it sounds, because every step in the chain changes what you are counting. You start with a crowd, which is people. You turn that crowd into orders, which are transactions. You turn orders into portions of each individual menu item. You turn portions into cooked weight, and only then do you turn cooked weight into the raw weight that goes into the cart at the supplier. Every one of those conversions loses something along the way, and if you skip one of them you will buy the wrong amount of food without ever understanding why it came out wrong.
Or call/text (321) 948-9588. Dr. Paul answers personally.
Last Updated: 9/7/2026 · Reviewed by Dr. Paul Borosky, DBA, MBA
Start Here
What information determines how much food to prep for a food truck event?
Three numbers do most of the work: who is there during your hours, how many of them buy a meal, and how many of those meals are yours.
Start with the event's attendance definition. Ask whether the estimate represents unique people, ticket scans, or visits over several days. Ask how many people are expected during the hours you will serve. A weekend attendance total cannot be dropped into a forecast for a single afternoon without adjustment.
Next, estimate the share likely to buy a meal from the available vendors. That is the meal-purchase rate. Some people arrive after eating. Others bring food, buy only a drink, or leave before the meal period. The event's length and purpose affect the buying occasion, but your forecast still needs evidence from comparable services.
Then estimate your share of those meal purchases. This is different from the meal-purchase rate. If half the crowd buys food, your truck does not automatically serve half the crowd. Other vendors compete for that demand. Define each percentage in writing so you do not use the same reduction twice.
An equal split among meal vendors can provide a first baseline. In Dr. Paul's experience it is rarely the final answer, because the vendors on that list are not interchangeable. A dessert cart takes part of the crowd's spending but rarely replaces a full meal, so counting it as an equal competitor understates your share. A truck parked beside the main seating area will move more food than one tucked behind a stage, so counting them the same way overstates it. Similar menus, prices, visibility, and service speed all affect the share you can reasonably expect, and each one is worth a minute of thought before you accept the simple division.
Ask for the final vendor list and site map. If the organizer has only a tentative list, record that uncertainty. A forecast based on six meal trucks changes when nine arrive. Recheck the count before the purchasing deadline and decide in advance which quantities you can still adjust.
Use your own event records wherever possible. Save attendance estimates, actual orders, menu mix, service hours, weather, placement, and sellout times. Records from a similar lunch event are more useful than a national claim about how many people food trucks usually serve. The comparison needs to resemble your menu and buying occasion.
Also ask whether customers can make multiple purchases during your shift. A long event may generate a second snack purchase, but do not assume every attendee buys multiple meals. If repeated purchases materially affect the forecast, model them separately using evidence rather than quietly multiplying the attendance figure.
The Arithmetic
How do you turn attendance into an order forecast?
One formula, three cases, and a capacity check that decides which of the three you are allowed to plan around.
Use one clear formula: relevant attendance × meal-purchase rate × your share of meal purchases = expected orders. If you use an equal vendor split for the initial estimate, your share is one divided by the number of comparable meal vendors.
Worked example
Consider an illustrative event with 4,000 unique attendees relevant to your service period and nine comparable meal vendors. Assume 45% buy one meal from those vendors. That produces 4,000 × 45% = 1,800 meal purchases. An equal share gives your truck 1,800 ÷ 9 = 200 orders.
Build the low case using a 30% meal-purchase rate and the same equal share: 4,000 × 30% ÷ 9 = 133.33 orders. Use 134 whole orders for the planning case. At a 60% meal-purchase rate, the high case is 4,000 × 60% ÷ 9 = 266.67, or 267 orders.
The three cases are therefore 134, 200, and 267 orders. The 30%, 45%, and 60% rates are illustrative assumptions, not industry benchmarks. The equal split is also an assumption. Replace both with evidence from your own records as soon as you have it.
If history supports an 8% share of meal purchases instead of one ninth, the expected case changes to 4,000 × 45% × 8% = 144 orders. Do not then divide 144 by nine. The 8% already describes your share after competition. Dividing again would reduce demand twice.
Now check capacity. Suppose a four-person event crew has demonstrated 45 completed orders per hour, above the 35 an hour a three-person crew reaches in normal service, and the useful meal window lasts five hours. The initial capacity ceiling is 45 × 5 = 225 orders. You should not build a plan around serving 267 unless you can support a higher pace, a longer useful service period, or another tested capacity improvement.
Even 225 may be optimistic if orders arrive unevenly. If half the demand appears during one hour, unused capacity earlier in the day does not automatically carry forward. Check the event schedule for performance breaks, shift releases, and other demand spikes. Match the prep sequence to the hours when customers will actually order.
Use the high case to identify the constraint, not to justify buying everything. In this example, the high demand case exceeds demonstrated service capacity. That directs attention to food truck staffing and throughput before the owner spends money on ingredients for orders the truck cannot complete.
Orders to Pounds
How do orders become portions and raw purchasing weights?
Every conversion loses something. Skip one and you buy the wrong amount without knowing why.
Forecast menu items separately. Two hundred orders could mean 200 main meals, or fewer transactions containing multiple meals, depending on how you defined the starting unit. In this example, each forecast order represents one main meal. State that assumption before multiplying ingredient quantities.
Assume the 200-meal expected case splits into 50% chicken bowls, 30% pork bowls, and 20% vegetable bowls. That means 100 chicken portions, 60 pork portions, and 40 vegetable portions. The counts sum to 200. Side dishes and drinks should have separate attachment assumptions rather than be assumed on every sale.
Suppose each chicken bowl contains five ounces of cooked chicken. You need 100 × 5 = 500 cooked ounces. Divide by 16 to convert ounces into pounds: 500 ÷ 16 = 31.25 pounds of cooked chicken. That is the usable requirement, not the raw purchase weight.
If your measured cooked yield is 75%, raw chicken required is 31.25 ÷ 0.75 = 41.67 pounds. If you deliberately include a 5% handling allowance, the purchase plan becomes 41.67 × 1.05 = 43.75 pounds. The yield and allowance are illustrative. Use measurements from the actual cut and preparation method you buy and serve.
For pork, 60 portions at five cooked ounces require 300 ounces, or 18.75 cooked pounds. At a measured 60% yield, raw weight is 18.75 ÷ 0.60 = 31.25 pounds. With the same illustrative 5% allowance, that becomes 32.81 pounds. Do not apply the chicken yield to pork simply because both are proteins.
Shared ingredients need their own calculation. If all 200 bowls use six ounces of cooked rice, total cooked rice is 1,200 ounces, or 75 pounds. Convert that to dry rice using your own measured batch yield. A supplier's package instructions can be a starting reference, but a tested batch tells you what your method actually produces.
For a sauce used on 160 meals at one ounce each, the requirement is 160 fluid ounces if the recipe specifies volume. Do not casually substitute weight ounces for fluid ounces. Keep recipe units consistent, especially when moving between supplier packages, measuring cups, and scales.
Finally, round purchasing quantities to available pack sizes and inspect the consequence. If chicken comes in 40-pound cases, needing 43.75 pounds may mean buying two cases unless smaller packs are available. The extra unopened inventory is a storage and cash decision. It is not a reason to cook 80 pounds for this event. Weigh that cash against the event's other committed spending, including the vendor fee covered in the food truck event fees guide, which is usually the largest fixed cost of attending, meaning a cost you owe in full whether you sell four hundred meals that day or forty.
Before the Gates Open
How much should you prepare before service starts?
Buying, prepping and cooking are three separate decisions with three separate deadlines.
Separate purchasing, preparation, and final production. You may buy ingredients for a higher case while initially preparing fewer portions, if unopened stock can be stored and used safely later. That flexibility depends on the food, storage capacity, approved procedures, and timing. It is not available equally across every menu.
A long-cook protein needs an earlier commitment than a garnish that can be replenished quickly. Classify each component by lead time and recoverability. Ask how long the next batch takes, whether it can be made at the event, and what happens to unused stock. The answers determine how much uncertainty the menu can tolerate.
Check cold and hot holding capacity before finalizing portions. Count usable space in the actual approved equipment. Do not plan around a cooler that is already full of drinks or a holding cabinet that cannot maintain conditions with the proposed load. Storage space is a limit on the plan, just like service speed.
Use local food safety requirements for cooking, cooling, reheating, holding, and leftover handling. The FDA Food Code is a model for jurisdictions, and the rules adopted for your operation determine the procedures you must follow. Extra food is not automatically reusable because it looks or smells acceptable.
Set a replenishment trigger using actual lead time. Suppose an approved next batch takes 30 minutes and recent demand is 20 portions per hour. You expect to use ten portions during that lead time. With a chosen five-portion operating cushion, trigger the batch when usable stock reaches 15 portions. Recalculate when demand changes.
This trigger is an inventory example, not a food safety holding instruction. It works only if the batch can be completed safely, equipment is available, and the ingredient plan supports it. Late in service, consider the time remaining before starting another batch. A full batch prepared for ten remaining customers creates predictable waste.
Give one person responsibility for the count. Track portions remaining by main item and note the next batch's status. If everyone assumes someone else is watching the chicken, the forecast will not prevent a surprise sellout. The count has to reflect usable portions, not a vague impression that a pan is half full. A prep plan this detailed only holds together when the same people work enough events to learn it, which is the practical argument for hiring food truck employees you can hand the count to.
Give AI your attendance assumption, meal-purchase rates, vendor share, menu mix, portion sizes, measured yields, and package sizes. Ask it to show low, expected, and high cases with every unit conversion, then compare its totals with your capacity. AI cannot validate an invented purchase rate or decide whether your storage and food handling meet local requirements; those checks remain yours.
After the Event
How do you improve the next forecast without adding a blanket buffer?
A buffer on everything is what owners add when they never found out which assumption was wrong.
Close the event by counting what sold, what remained usable, and what was discarded. Record waste at ingredient cost and identify the reason: spoilage, excessive production, portion mistakes, damage, or a quality rejection. A single leftovers number cannot tell you which part of the plan needs correction.
Separate demand error from menu-mix error. Selling 200 meals with leftover pork and sold-out chicken means total volume may have been right while the split was wrong. Increasing the entire prep list next time would add more of the item that already remained. Change the relevant assumption rather than every quantity.
Record the time of each sellout. If chicken sells out halfway through the meal window, its completed sales understate customer demand. Note requests you could not fill and substitutions accepted. You may need a controlled increase in chicken share even though the register alone shows no growth.
Compare forecast error in usable units. If you expected 200 meals and sold 170 without stockouts or service interruptions, you overestimated by 30 meals, or 15% of the forecast. Review attendance, meal-purchase rate, and vendor share to locate the mismatch. Do not assume all three were wrong by the same amount.
Calculate the cost of a proposed cushion before adopting it. An extra 25 portions at the $4.90 variable cost, which is the cost that exists only because you made and sold that portion, commits 25 × $4.90 = $122.50 in food, packaging, and fees. If the components can be used at the next approved service, much of that value may remain in inventory. If they must be discarded, that $122.50 is a direct cost of the decision. That distinction should determine where you place the cushion.
The food truck food cost percentage guide explains how waste affects the larger cost picture. Here, keep the correction tied to the next event's purchasing and batch plan. The point of recording all of this is that next time you change one or two specific assumptions and buy a little closer to what the event actually eats. If the review only produces a worksheet with more lines on it, and you still overbuy by the same forty pounds you overbought last year, the review did not do anything for you.
Show the whole forecast chain in the plan rather than just the answer at the end of it: audience, meal purchases, your truck's share, menu mix, portions, and purchasing quantities. Label every untested percentage as an assumption, so a lender or partner can see which links are measured and which are still estimates. A claim that the truck will serve a fixed percentage of a festival crowd is incomplete when it does not define the buying period or account for the competing vendors working the same crowd.
Do This
What Dr. Paul Would Do
On a new event, he prepped under the number on purpose.
Dr. Paul would make the organizer define attendance and confirm the meal vendor count before he built anything, then cap the service plan at demonstrated capacity rather than at the high case. On the first visit to a new event he would deliberately prep under the expected number and accept selling out early. That is not caution for its own sake. Guessing high costs real food in the bin and real cash you do not get back, while guessing low costs you a few late orders and buys a measured attendance figure you can build on next year. After service he would record waste and sellout times the same night, while the reasons are still fresh.
FAQ
Frequently asked questions
The four questions Dr. Paul gets most about event prep quantities.
Should I prepare one portion for every attendee?
What percentage should I add for safety stock?
Is selling out always a good result?
Can I carry leftovers into the next event?
Next Step
Turn Attendance Estimates Into a Usable Prep Plan
Prep that swings between bins of leftovers one weekend and a sold-out window by two o'clock the next is a forecasting problem, not a cooking problem. To work through yours, see Dr. Paul's business consulting options. Bring menu recipes and the last few event records. Prep quantities should support the operating and cash targets in your food truck business plan.
Everything on this page sits inside a larger system. Start at the food truck business hub for the whole picture: the industry as it stands today, the eight Organize steps, the business plan and financial model, the five numbers that decide profit, marketing, and when to add the second truck.
Dr. Paul Directly
Consulting and Business Plan Writing
Dr. Paul writes every plan himself. No hand-offs, no junior staff. Fourteen plus years helping food truck and small business owners turn a busy operation into a profitable one.

The Food Truck Business All-in-One Handbook
The full Organize-Plan-Grow system in book form. The eight steps before you buy anything, the five numbers that decide whether a truck makes money, and the growth decisions that come after.
Food Truck Business Plan Template
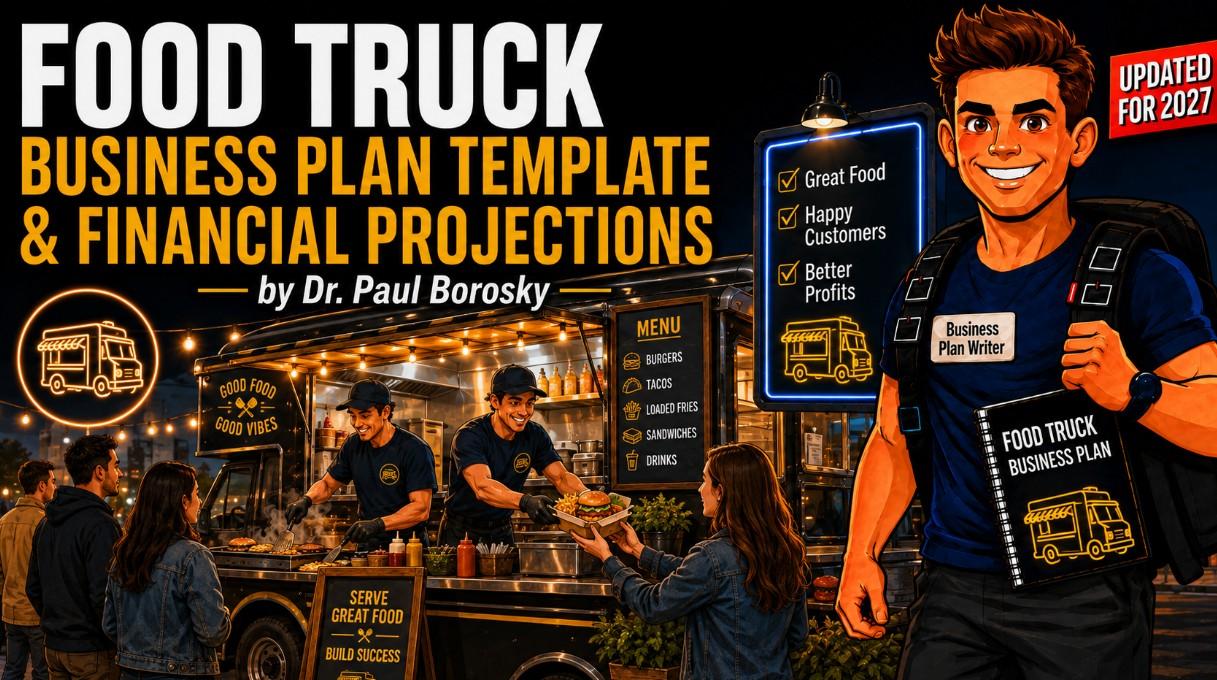
An editable Word plan and an Excel financial model. Set your average ticket, your costs, and your volume, and it builds a 12 month profit and loss statement, a 5 year pro forma, a break-even analysis, and a valuation based on cash flow.
Dr. Paul Borosky, DBA, MBA
Business Consultant & Fractional CFO | 14+ Years | 1,000+ Clients Served
Dr. Paul Borosky, DBA, MBA, business consultant and fractional CFO, is dedicated to making CEOs stronger, sharper, and more effective. He is the founder of Quality Business Plan, creator of Dr. Paul's Organize-Plan-Grow™ Strategy, author of numerous published books on Amazon including The Food Truck Business All-in-One Handbook, and publisher of over 1,000 business-focused videos on YouTube. For over 14 years, he has helped food truck, restaurant, and small business owners turn a busy operation into a profitable one.
Attendance figures, purchase rates, vendor counts, yields and dollar figures on this page are illustrations used to show the calculation, not projections for your business. The 4,000 attendees, the 30, 45 and 60 percent meal-purchase rates, the equal split among nine vendors, the 75 and 60 percent yields and the $4.90 variable cost are assumptions, not industry benchmarks. Food safety requirements are set by the authority with jurisdiction over your operation. Source: U.S. Food and Drug Administration, FDA Food Code. Always verify current details before making business decisions.