🚀 Decode Alphabet's 2023 Financial Alphabet Like a Pro! 📊
Alphabet 2023 Beginner’s Guide Introduction:
Welcome, aspiring financial virtuosos! Are you set to dissect the financial DNA of Alphabet in 2023? Delve into "Alphabet 2023: Beginner's Guide to Financial Analysis," your premier resource from Quality Business Consultant, authored by the adept finance specialist, Paul Borosky, MBA. This guide transcends mere numbers; it's your passport to unraveling the fiscal intricacies of the tech behemoth behind Google!
Why You'll Love This Guide:
- Expert Guidance: 🎓 Journey through Alphabet's 2023 financial landscape with insights from Paul Borosky, MBA, brought to you by Quality Business Consultant.
- Financial Exploration: 📉 Get a summary Alphabet's income statements and balance sheets for 2023, dissecting the company's financial prowess.
- Comprehensive Ratio Analysis: 🧮 Explore over twenty pivotal financial ratios to gauge Alphabet's economic health and strategic positioning.
- Financial Jargon Demystified: 📚 Our "In other words" sections break down complex financial terms into digestible, relatable insights.
- Strategic Analysis Tips: 💡 Employ Paul's tailored analysis tips to refine your financial analysis acumen, beneficial for both your academic journey and professional growth.
- Extended Insights with In-Depth Report: 🔍 For granular financial understanding, our "Financial Analysis & Report" offers a thorough examination of Alphabet, combining AI-driven insights with Paul Borosky's analytical expertise.
Guide Highlights:
- A reader-friendly Legal Disclaimer
- An engaging Forward that paves the way for your financial expedition
- In-depth scrutiny of Income Statements and Balance Sheets for 2023
- A deep dive into Financial Ratios, enhancing your financial detective skills
- An encyclopedia of financial insights at your disposal!
Table of Contents Sneak Peek:
- Income Statement Exploration: Unraveling revenues, costs, and operational insights
- Balance Sheet Analysis: Investigating assets, liabilities, and equity – the pillars of financial equilibrium
- Financial Ratios Deciphered: Arming you with the tools to analyze Alphabet's financial narratives
Who's This For?
Tailored for the industrious business student or the enterprising entrepreneur, this guide is your gateway to mastering financial analysis with a focus on Alphabet.
Unlock Your Financial Acumen:
Elevate your financial literacy with "Alphabet 2023: Beginner's Guide to Financial Analysis." Transform daunting financial statements into a playground of strategic opportunities.
Additional Note: This beginner's guide is crafted to lay a foundational understanding of essential financial principles, centering on income statements, balance sheets, and crucial financial ratios for their analysis. It provides a summarized portrayal of Alphabet's financials, complete with specific data, calculations, and ratios to guide your analytical pursuits. While the guide furnishes you with the analytical tools, the depth of financial exploration is in your hands. For those desiring a comprehensive, company-specific financial analysis, our "Financial Analysis & Report" presents detailed insights, merging AI precision with Paul Borosky, MBA's seasoned expertise.
PDF/Downloadable Versions

Click Below for the CURRENT
Downloadable PDF Price!!

Click Below for the CURRENT
Downloadable PDF Price!!
Sample Financial Report


Alphabet Inc.: Brief Summary
Alphabet is located at 1600 Amphitheatre Parkway in Mountain View, CA. The company competes in the technological sector. Their industry is related to Internet content and information. The most recent estimate of the company’s employee count is about 174,000. Sundar Pichai leads the firm. Other members of their executive team would include Lawrence Page, Ruth Porat, and Sergey Brin (8/22).
Alphabet Inc., commonly known as Google, offers Internet content and advertising services to residents and businesses in the United States, European Union, Middle East, Africa, Canada, and other countries. Popular services the firm provides include advertisements, digital content, cloud services, home connectivity, and other products and software services. The firm was established in 1998.
Alphabet (Google) Financial Report Sources
“Alphabet Inc. (Google) 2021 Financial Statements and Financial Ratios: Defined, Discussed, and Analyzed for 5 Years” was written by Paul Borosky, MBA., and owner of Quality Business Plan. In this report, the author selected Alphabet’s 2019 10k, Alphabet’s 2017 10k annual report, Alphabet’s 2016 10k annual report, Alphabet’s 2015 10k annual report, and Alphabet’s 2014 10k annual report as the basis for information gathering. Once all of Alphabet’s 10k annual statements were collected, the author then inserted Alphabet’s income statement information and Alphabet’s balance sheet information into a customized financial template.
Section 1: Alphabet Inc. Income Statement Analyzed
In this section, I walk through a broad definition of what an income statement is and why it is crucial. I discuss each of Alphabet’s essential income statement line items, such as revenues, gross profits, etc., in detail. After each line item is defined and discussed, I must analyze Alphabet’s income statement line items.
Revenue Growth:
Alphabet’s revenues were $110.8 billion in 2017. In the next four years, Alphabet’s revenues would climb to $257.6 billion in 2021. On average, this is an annual growth rate of approximately 23.9%. For multinational organizations such as this, this is extraordinarily impressive.
Analyst Grade: A
Alphabet 2023 Summary Income Statement |
|||||
| Column1 | 2023 | 2022 | 2021 | 2020 | 2019 |
| Revenues | 307,394 | 282,836 | 257,637 | 182,527 | 161,857 |
| COGS | 110,939 | 126,203 | 110,939 | 84,732 | 71,896 |
| Gross Profit | 196,455 | 156,633 | 146,698 | 97,795 | 89,961 |
| SG&A | 44,342 | 42,291 | 36,422 | 28,998 | 28,015 |
| Depreciation | 11,946 | 13,475 | 10,273 | 12,905 | 10,856 |
| R & D | 45,427 | 39,500 | 31,562 | 27,573 | 26,018 |
| Other | - | - | - | ||
| Total Operating Expenses | 223,101 | 207,994 | 178,923 | 141,303 | 127,626 |
| EBIT | 84,293 | 74,842 | 78,714 | 41,224 | 34,231 |
| Other Income | 1,424 | (3,514) | 12,020 | 6,858 | 5,395 |
| Interest Expense | |||||
| EBT | 85,717 | 71,328 | 90,734 | 48,082 | 39,625 |
| Taxes | 11,922 | 11,356 | 14,701 | 7,813 | 5,282 |
| Net Income | 73,795 | 59,972 | 76,033 | 40,269 | 34,343 |
Section 2: Alphabet Inc. Balance Sheet Analyzed
For Alphabet Inc.’s balance sheet, I again go through each vital line item from the balance sheet. In reviewing each line item, I will define Alphabet’s balance sheet line items, such as cash, property, plant and equipment, and liabilities. Next, I offer an analysis of Alphabet’s balance sheet line item.
Cash:
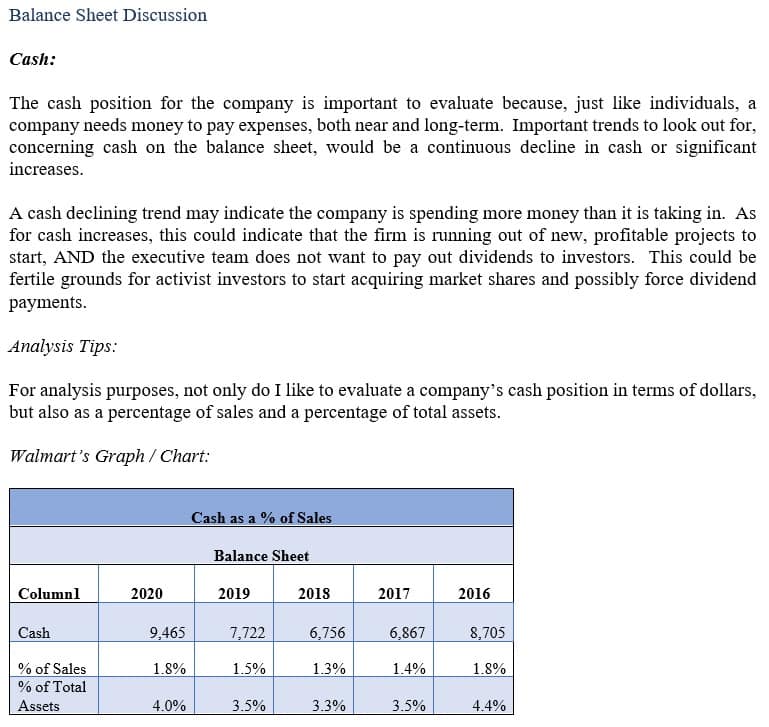
Alphabet’s cash position was $10.7 billion in 2017. As compared to sales, this would be 9.7%. In the next four years, Alphabet’s cash increased to $20.9 billion in 2021. As compared to sales, this would be 8.1%. This trend indicates that the organization is increasing its cash position. However, they are not increasing it as fast as sales are growing. This shows that the company can meet its short-term liabilities by utilizing less cash as a percentage of sales—an excellent strategy and structure.
Analyst Grade: A
Alphabet 2023 Summary Balance Sheet |
|||||
| Column1 | 2023 | 2022 | 2021 | 2020 | 2019 |
| Cash | 24,048 | 21,879 | 20,945 | 26,465 | 18,498 |
| Short Term Investment | 86,868 | 91,883 | 118,704 | 110,229 | 101,177 |
| Account Receivable | 47,964 | 40,258 | 39,304 | 30,930 | 25,326 |
| Inventory | - | - | 1,170 | 728 | 999 |
| Other | - | - | - | - | - |
| Current Assets | 171,530 | 164,795 | 188,143 | 174,296 | 152,578 |
| Net PPE | 134,345 | 112,668 | 97,599 | 84,749 | 73,646 |
| Goodwill | 29,198 | 28,960 | 22,956 | 21,175 | 20,624 |
| Other | - | - | - | - | - |
| Total Assets | 402,392 | 365,264 | 359,268 | 319,616 | 275,909 |
| Accounts Payable | 7,493 | 5,128 | 6,037 | 5,589 | 5,561 |
| Accrued Expense | 61,308 | 51,894 | 45,125 | 39,717 | 31,562 |
| Accrued Taxes | - | - | 808 | 1,485 | 274 |
| Notes Payable | - | - | - | - | - |
| LT Debt - Current | - | - | - | - | - |
| Other | - | - | - | - | - |
| Total Current Liabilities | 81,814 | 69,300 | 64,254 | 56,834 | 45,221 |
| LT Debt | 13,253 | 14,701 | 14,817 | 13,932 | 4,554 |
| Other | - | - | - | - | - |
| Total Liabilities | 119,013 | 109,120 | 107,633 | 97,072 | 74,467 |
| Common Stock | 76,534 | 68,184 | 61,774 | 58,510 | 50,552 |
| Treasury | - | - | - | - | - |
| Retained Earnings | 211,247 | 195,563 | 191,484 | 163,401 | 152,122 |
| Other | - | - | - | - | - |
| Total Equity | 283,379 | 256,144 | 251,635 | 222,544 | 201,442 |
| Total Equity & Liability | 402,392 | 365,264 | 359,268 | 319,616 | 275,909 |
Section 3: Alphabet Inc. Financial Ratios Analyzed
For this section, I have chosen about 16 different financial ratios to review for Alphabet. In reviewing each of Alphabet’s financial ratios, I first define the financial ratio. Next, I supply the financial formula for calculating the specific ratio. Finally, I offer a brief analysis of Alphabet’s Financial ratio. Ratios calculated for the last five years include:
Alphabet (Google) Current Ratio
Alphabet’s current ratio was 5.14 in 2017. In the next several years, the company took steps to reduce its current ratio, ending in 2021 at 2.9. Since the current ratio's gold standard is 1.0, Alphabet seems to be mismanaging its current assets. A better strategy would be for the organization to divest significant portions of its cash into operations, expansion, and or dividend payouts. From an investor’s perspective, this is a poor trend.
Analyst Grade: C
Alphabet (Google) Return on Assets (ROA)
Alphabet’s return on assets (ROA) was 6.4% in 2017. In the next three years, ending 2020, the company would almost double its return on assets, ending the year at 12.6%. Further, in 2021, the company’s return on assets would jump significantly, ending at 21.1%. This trend shows that the company is continually generating additional revenues using the assets of its management.
Analyst Grade: A