
Dr. Paul Borosky, DBA, MBA
College Professor · Business Consultant
How to Value a Stock With the Constant Growth Formula The Gordon Growth Model, Step by Step
If a company grows its dividend at a steady rate forever, its stock is worth next year's dividend divided by the gap between your required return and that growth rate. Watch Dr. Paul solve it, then work the same problem below.
Last Updated: 10/30/2026 · Written by Dr. Paul Borosky, DBA, MBA
Watch First
Watch: Constant Growth Formula for Stocks
The Short Answer
What Is the Constant Growth Stock Valuation Formula?
The constant growth model, also called the Gordon growth model, values a stock as the present value of dividends that grow at the same rate forever. Divide next year's dividend by the required return minus the growth rate. It only works when the required return is bigger than the growth rate.
P0 = D1 ÷ (r − g)
D1 = D0 × (1 + g)
- P0
- Value of the stock today
- D0
- Dividend just paid
- D1
- Dividend expected next year
- r
- Required rate of return, as a decimal
- g
- Constant dividend growth rate, as a decimal. Must be less than r
Want to Value It Like an Analyst?
Step by Step
How Do You Calculate Stock Price With the Gordon Growth Model?
A company just paid a $2.00 dividend. Dividends grow 4% a year, and you require a 10% return. What is the stock worth today?
- 1
Spot whether you have D0 or D1
"Just paid" means D0 = $2.00. The formula needs next year's dividend, so you have to grow it first.
- 2
Grow the dividend one year
D1 = $2.00 × 1.04 = $2.08.
- 3
Find the gap between r and g
0.10 − 0.04 = 0.06. Check that it is positive. It is, so the model works.
- 4
Divide
P0 = $2.08 ÷ 0.06 = $34.67. That is the value of the stock today.
- 5
See what the D0 mistake costs
Plug in $2.00 in place of $2.08 and you get $2.00 ÷ 0.06 = $33.33. Off by $1.34, and it is the most common error on this problem.
How do you solve for the required return?
Rearrange the formula: r = D1 ÷ P0 + g. A stock trades at $40.00, next year's dividend is $1.80, and dividends grow 5%. Then r = $1.80 ÷ $40.00 + 0.05 = 0.045 + 0.05 = 9.50%. The first piece is the dividend yield. The second is the growth. Together they are the return the market is pricing in.
The model is extremely sensitive to the gap between r and g. Move g from 4% to 5% and this stock jumps from $34.67 to $42.00. If r equals g you divide by zero. If g is bigger than r you get a negative price, which is nonsense. When that happens, the model does not fit the company. It is not a math problem to force through.
In Excel
How Do You Calculate Constant Growth Stock Price in Excel?
Put D0 in B1, g in B2, and r in B3. One formula grows the dividend and values the stock: =B1*(1+B2)/(B3-B2). Change any input and watch the price move.
| Problem | Excel formula | Answer |
|---|---|---|
| D0 $2.00, g 4%, r 10% | =2*(1+4%)/(10%-4%) | $34.67 |
| Same, but r 9% | =2*(1+4%)/(9%-4%) | $41.60 |
| Same, but r 11% | =2*(1+4%)/(11%-4%) | $29.71 |
| D0 $2.00, g 5%, r 10% | =2*(1+5%)/(10%-5%) | $42.00 |
| Solve for r: P0 $40, D1 $1.80, g 5% | =1.8/40+5% | 9.50% |
A one point change in r swings the price by roughly $5 to $7. That is why analysts argue so hard about the required return. Add a guard if you build a template: =IF(B3>B2,B1*(1+B2)/(B3-B2),"r must exceed g").
Avoid These
What Are the Most Common Constant Growth Model Mistakes?
- Using D0 in place of D1. "Just paid" or "last paid" means D0. Multiply by (1 + g) first.
- Growing a dividend that is already D1. "Expected next year" means D1. Do not grow it again.
- Ignoring the r > g rule. If growth is equal to or higher than the required return, the model breaks. Use a different method.
- Subtracting in the wrong order. It is r minus g. Flip it and the price goes negative.
- Using it on companies that do not pay steady dividends. No dividend, or wildly uneven ones, means no constant growth. The model does not apply.
Real World Use
How a Student Uses the Constant Growth Model
Is the utility stock a buy at $24?
Your case study: a utility just paid a $1.50 dividend, grows it 6% a year, and you require 12%. The stock trades at $24.00. Should the investor buy?
Grow the dividend: D1 = $1.50 × 1.06 = $1.59. Value it: $1.59 ÷ (0.12 − 0.06) = $1.59 ÷ 0.06 = $26.50. In Excel, =1.5*(1+6%)/(12%-6%) gives the same $26.50.
The model says the stock is worth $26.50 and it costs $24.00, so it looks undervalued at a 12% required return. Then name the risk: if growth slows, the value falls fast. That is analysis, not just arithmetic.
Keep Going
More Videos in This Series
Constant Growth Stock Price Template and Calculator in Excel
Dr. Paul builds a reusable Excel calculator for constant growth stock prices. (7:32)
Calculating Preferred Stock Price and Required Rate of Return
Dr. Paul values a stock whose dividend does not grow at all. (12:41)
Dividend Yield Problem Solved in Excel and by Hand
Dr. Paul explains the dividend yield piece of the required return. (8:24)
Questions
Constant Growth Model Questions Students Ask
What is the Gordon growth model formula?
What is the difference between D0 and D1?
Why must the required return be greater than the growth rate?
How do you solve for the required rate of return?
How do I calculate constant growth stock price in Excel?
=B1*(1+B2)/(B3-B2). For a $2.00 dividend, 4% growth, and a 10% required return, Excel returns $34.67.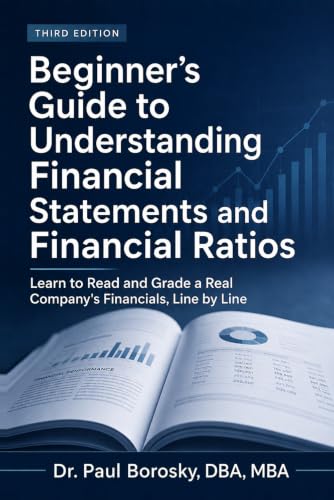
Dividend models start with the financial statements.
Dr. Paul's Beginner's Guide to Understanding Financial Statements and Financial Ratios shows where dividends, earnings, and cash flow live in Apple's actual 10-K, so you can judge whether a growth rate is realistic.
Written by Dr. Paul Borosky, DBA, MBA, current college professor, business consultant, and author with 14+ years and 1,000+ businesses served.
This page is for general educational purposes only. It is not financial, investment, legal, or tax advice.