
Dr. Paul Borosky, DBA, MBA
College Professor · Business Consultant
How to Calculate NPV, IRR, and Payback Period With a Worked Example in Excel
A big purchase looks good on paper until you account for time. NPV, IRR, and payback answer three questions: does it create value, what does it return, and how fast do you get your cash back? Watch Dr. Paul solve a full problem, then follow the steps below.
Last Updated: 10/30/2026 · Written by Dr. Paul Borosky, DBA, MBA
Watch First
Watch: Capital Budgeting Example Problem Solved Using NPV, IRR, and Payback
The Short Answer
What Are NPV, IRR, and Payback Period?
NPV is the value a project adds after discounting every future cash flow back to today and subtracting the cost. IRR is the discount rate that makes NPV equal zero. Payback period is how many years it takes to earn back the original cost. Accept a project when NPV is positive and IRR beats your required rate.
NPV = Σ CFt ÷ (1 + r)t − CF0
- CFt
- Cash flow in year t
- CF0
- Upfront cost at time zero
- r
- Discount rate or required return, often the company's WACC
- IRR
- The r that makes NPV = 0
- Payback
- Years before the last negative cumulative year + (amount still owed ÷ next year's cash flow)
Should You Make That Investment?
Step by Step
How Do You Calculate NPV, IRR, and Payback?
Say a project costs $50,000 today and returns $15,000, $18,000, $20,000, and $12,000 over the next four years. The required return is 10%.
| Year | Cash flow | Discount factor at 10% | Present value | Cumulative cash |
|---|---|---|---|---|
| 0 | −$50,000 | 1.0000 | −$50,000.00 | −$50,000 |
| 1 | $15,000 | 1 ÷ 1.1000 | $13,636.36 | −$35,000 |
| 2 | $18,000 | 1 ÷ 1.2100 | $14,876.03 | −$17,000 |
| 3 | $20,000 | 1 ÷ 1.3310 | $15,026.30 | $3,000 |
| 4 | $12,000 | 1 ÷ 1.4641 | $8,196.16 | $15,000 |
| NPV | $1,734.85 | |||
- 1
Discount each cash flow
Divide each year's cash by (1.10)t. Year 1: $15,000 ÷ 1.10 = $13,636.36. Repeat for every year.
- 2
Add the present values
$13,636.36 + $14,876.03 + $15,026.30 + $8,196.16 = $51,734.85.
- 3
Subtract the cost for NPV
$51,734.85 − $50,000 = $1,734.85. Positive, so the project adds value at a 10% required return.
- 4
Find the IRR
IRR is the rate where NPV hits zero. Solved in Excel, it is 11.62%. That beats the 10% requirement, which agrees with the positive NPV.
- 5
Find the payback period
After year 2 you still owe $17,000. Year 3 brings $20,000. Payback = 2 + ($17,000 ÷ $20,000) = 2.85 years.
Payback is the number owners understand fastest, and it is the weakest of the three. It ignores the time value of money and everything after the break-even year. Use payback as a cash comfort check. Use NPV to make the actual decision.
In Excel
How Do You Calculate NPV and IRR in Excel?
Put the cash flows in B1:B5, with the −50,000 cost in B1 and years 1 to 4 in B2:B5. Here is the trap: Excel's NPV() treats the first cell as one year away. So leave the time zero cost out of the range and add it on at the end.
| What you want | Excel formula | Result |
|---|---|---|
| NPV (correct) | =NPV(10%,B2:B5)+B1 | $1,734.85 |
| NPV (wrong: cost inside the range) | =NPV(10%,B1:B5) | $1,577.14 |
| IRR | =IRR(B1:B5) | 11.62% |
| NPV at a 12% required return | =NPV(12%,B2:B5)+B1 | −$395.83 |
The wrong version discounts the cost by a full year, which understates the answer. Also notice the last row: at 12%, NPV turns negative. That fits, because 12% is above the 11.62% IRR. IRR() does include B1, since it needs the cost to find the break-even rate.
Avoid These
What Are the Most Common NPV and IRR Mistakes?
- Putting the time zero cost inside NPV(). Use
=NPV(r, CF1:CFn)+CF0. This is the most common spreadsheet error on capital budgeting problems. - Entering the cost as a positive number. The upfront cost is cash out. It must be negative or IRR returns an error.
- Using profit instead of cash flow. Depreciation is not cash. Use the cash the project actually brings in.
- Deciding on payback alone. A fast payback can still lose value after year three. Check NPV.
- Picking a random discount rate. Use the company's WACC or a stated hurdle rate. The rate drives the answer.
- What Is Opportunity Cost? Examples for Small Business
Real World Use
How an Owner Uses NPV, IRR, and Payback
A $120,000 machine that saves $32,000 a year
An owner is quoted $120,000 for a machine. It should save $32,000 a year in labor and outsourcing for five years. The owner wants at least a 9% return on any cash tied up in the business.
Payback: $120,000 ÷ $32,000 = 3.75 years. NPV at 9%: =NPV(9%,B2:B6)+B1 returns $4,468.84. IRR: =IRR(B1:B6) returns 10.42%. Positive NPV and an IRR above 9% say buy.
Then the stress test. If the real hurdle is 12%, NPV drops to −$4,647.16 and the deal no longer works. The decision is not "is this a good machine?" It is "what does your money cost?" Knowing that number before signing is what keeps the owner from a costly yes.
Keep Going
More Videos in This Series
What Is an NPV Profile and How to Make One in Excel
Dr. Paul charts how NPV changes as the discount rate moves. (13:09)
How to Use a Capital Budgeting Template in Excel
Dr. Paul shows a reusable sheet that solves NPV, IRR, and payback. (4:37)
Calculating WACC Using a Formula
Dr. Paul calculates the discount rate most companies use for NPV. (4:38)
Questions
NPV, IRR, and Payback Questions Owners Ask
What is the difference between NPV and IRR?
Why does Excel NPV give the wrong answer?
NPV() assumes the first cash flow comes one period from now. If you include the upfront cost in the range, Excel discounts it by a year. Use =NPV(rate, CF1:CFn)+CF0 instead.How do you calculate the payback period?
What is a good IRR for a small business investment?
Should you use NPV or payback to decide?
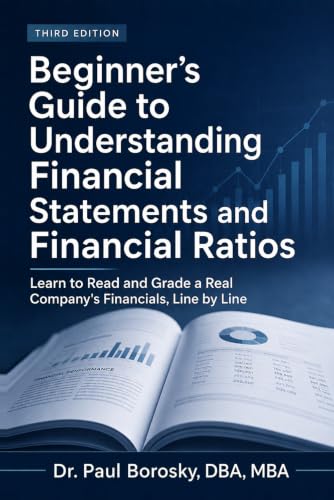
Investment decisions start with cash flow you can trust.
Dr. Paul's Beginner's Guide to Understanding Financial Statements and Financial Ratios shows how to read the cash flow statement and the ratios behind it, using Apple's actual 10-K, in plain English.
Written by Dr. Paul Borosky, DBA, MBA, current college professor, business consultant, and author with 14+ years and 1,000+ businesses served.
This page is for general educational purposes only. It is not financial, investment, legal, or tax advice.