
Dr. Paul Borosky, DBA, MBA
College Professor · Business Consultant
Public Company Financial Analysis Real Companies, Real Numbers
Textbook examples are clean. Real 10-Ks are not. Dr. Paul has analyzed 23 public companies on video, from Apple to FedEx. Pick a company, watch the breakdown, then use the same five steps on yours.
Last Updated: 10/30/2026 · Written by Dr. Paul Borosky, DBA, MBA
Watch First
Watch: Amazon Financial Report: Statements and Ratio Analysis
The Short Answer
What Is a Public Company Financial Analysis?
A public company financial analysis takes the income statement, balance sheet, and cash flow statement from a company's annual report, lines up several years side by side, and calculates ratios to judge growth, profitability, liquidity, and debt. The goal is a plain verdict: is this company getting stronger or weaker?
Professors assign real companies for one reason. Real numbers are messy. You have to find the right line, deal with odd labels, and explain a trend in your own words. That is the skill employers want, and it is the skill a clean textbook problem never tests.
Public companies are perfect practice because their annual reports are free. Every company that trades on a U.S. exchange files a 10-K with the SEC, so you can check every number Dr. Paul uses.
Want the Full Company Breakdown?
The Library
Which Companies Has Dr. Paul Analyzed?
Here is every company in the video library, sorted by how often students watch it. Click a year to open that video on YouTube. The table covers 23 companies across 68 videos.
| Company | Years (click to watch) | What the videos cover | Videos |
|---|---|---|---|
| Apple | 2020, 2021, 2022, 2023, 2024 | Five-year statements and ratio summary, beginner's guide walk-through, short lessons on COGS, cash, and liquidity ratios | 9 |
| Amazon | 2020, 2021, 2022 | Five-year statements and ratio summary, beginner's guide walk-through, short lessons on COGS, cash, and liquidity ratios | 10 |
| Tesla | 2020, 2021, 2022 | Five-year statements and ratio summary, beginner's guide walk-through, short lessons on COGS, cash, and liquidity ratios | 10 |
| Starbucks | 2020, 2021, 2022 | Five-year statements and ratio summary, beginner's guide walk-through, short lessons on COGS, cash, and liquidity ratios | 7 |
| Nike | 2020, 2021, 2022 | Five-year statements and ratio summary, beginner's guide walk-through, short lessons on COGS, cash, and liquidity ratios | 6 |
| Walmart | 2021, 2022 | Five-year statements and ratio summary, beginner's guide walk-through | 3 |
| Coca-Cola | 2020, 2021 | Five-year statements and ratio summary | 2 |
| McDonald's | 2020, 2021 | Five-year statements and ratio summary | 2 |
| Netflix | 2020, 2022 | Five-year statements and ratio summary, beginner's guide walk-through | 2 |
| Disney | 2020, 2022 | Five-year statements and ratio summary, beginner's guide walk-through | 2 |
| Costco | 2020, 2022 | Five-year statements and ratio summary, beginner's guide walk-through | 2 |
| Intel | 2021, Report | Five-year statements and ratio summary, beginner's guide walk-through | 2 |
| General Motors | 2021 | Beginner's guide walk-through | 1 |
| Ford | 2021 | Beginner's guide walk-through | 1 |
| Boeing | 2021 | Beginner's guide walk-through | 1 |
| Alphabet (Google) | 2021 | Beginner's guide walk-through | 1 |
| Microsoft | 2022 | Beginner's guide walk-through | 1 |
| Darden Restaurants | 2022 | Beginner's guide walk-through | 1 |
| FedEx | 2022 | Beginner's guide walk-through | 1 |
| Meta (Facebook) | 2021 | Beginner's guide walk-through | 1 |
| Walgreens | 2022 | Beginner's guide walk-through | 1 |
| AT&T | 2021 | Beginner's guide walk-through | 1 |
| Southwest Airlines | 2021 | Beginner's guide walk-through | 1 |
New to this? Start with a company you already buy from. Apple, Nike, and Starbucks are easy to picture, which makes the numbers easier to explain.
Step by Step
How Do You Analyze a Company in Five Steps?
This is the same order Dr. Paul uses in every video. Follow it and your paper writes itself.
- 1
Pull the statements and line up the years
Download the 10-K. Copy revenue, cost of goods sold, net income, total assets, liabilities, and equity for at least three years into one sheet. Not sure what each line means? Start with how to read financial statements.
- 2
Read the income statement for growth and margin
Is revenue rising? Is gross profit keeping pace? See how to read an income statement for each line in order.
- 3
Read the balance sheet for strength
Compare what the company owns to what it owes. Watch cash, inventory, and debt over time. See how to read a balance sheet.
- 4
Calculate the ratios
Liquidity first, then profitability. Use current ratio vs. quick ratio and ROA vs. ROE, and keep the financial ratios cheat sheet open.
- 5
Write the verdict
One paragraph per area: growth, profitability, liquidity, debt. Every claim gets a number. End with a single sentence: stronger, weaker, or mixed, and why.
Students lose the most points on step five, not step four. Calculating a ratio is easy. Explaining why it moved is the grade. If the current ratio dropped, say what caused it: more short-term debt, less cash, or a big inventory swing.
Avoid These
What Are the Most Common Company Analysis Mistakes?
- Analyzing one year. A single year tells you nothing about direction. Use three to five years.
- Listing ratios with no explanation. A table of numbers is not an analysis. Every ratio needs a sentence on what it means.
- Comparing across industries. A grocery chain and a software company have very different margins. Compare a company to itself and to direct competitors.
- Mixing fiscal years. Many companies do not end their year in December. Check the fiscal year end before you line up the columns.
- Copying the wrong line. Net sales, total revenue, and operating revenue can sit on different lines. Read the labels, not just the position.
Real World Use
How a Student Uses a Company Analysis Video
A practice dataset, solved before the real one
Your team gets a practice set first. These are example numbers, not a real company: revenue grew from $40.0 billion to $46.0 billion. Growth = ($46.0B − $40.0B) ÷ $40.0B = 15%.
Current assets are $28.0 billion, inventory is $9.8 billion, and current liabilities are $14.0 billion. Current ratio = $28.0B ÷ $14.0B = 2.0. Quick ratio = ($28.0B − $9.8B) ÷ $14.0B = 1.3.
Then each teammate watches one company video above and checks the method against Dr. Paul. Same steps, same order. When the real company arrives, nobody is guessing where to start.
Keep Going
More Videos in This Series
Apple Financial Analysis: COGS and Current Ratio
Dr. Paul digs into Apple cost of goods sold and liquidity across five years. (8:35)
Tesla Financial Report: Statements and Ratio Analysis
Five years of Tesla statements summarized, with the ratios that matter most. (8:56)
Walmart Financial Report: Statements and Ratio Analysis
Dr. Paul walks through how a giant retailer looks on paper over five years. (7:52)
Questions
Company Analysis Questions Students Ask
Where do I find a public company's financial statements?
How many years should a financial analysis cover?
Which financial ratios should I include in a company analysis?
What is the difference between a financial report and a financial analysis?
Can I compare two companies in different industries?
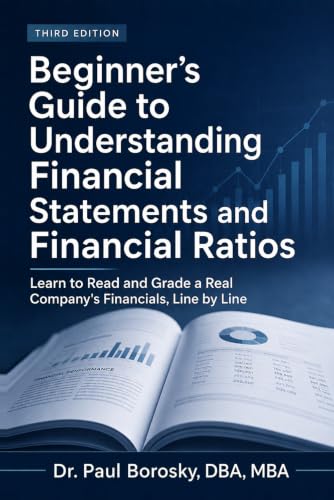
See every ratio worked out on a real 10-K.
Dr. Paul's Beginner's Guide to Understanding Financial Statements and Financial Ratios uses Apple's actual numbers to walk through each statement and ratio in plain English, the same way he teaches it in class.
Written by Dr. Paul Borosky, DBA, MBA, current college professor, business consultant, and author with 14+ years and 1,000+ businesses served.
This page is for general educational purposes only. It is not financial, investment, legal, or tax advice.